
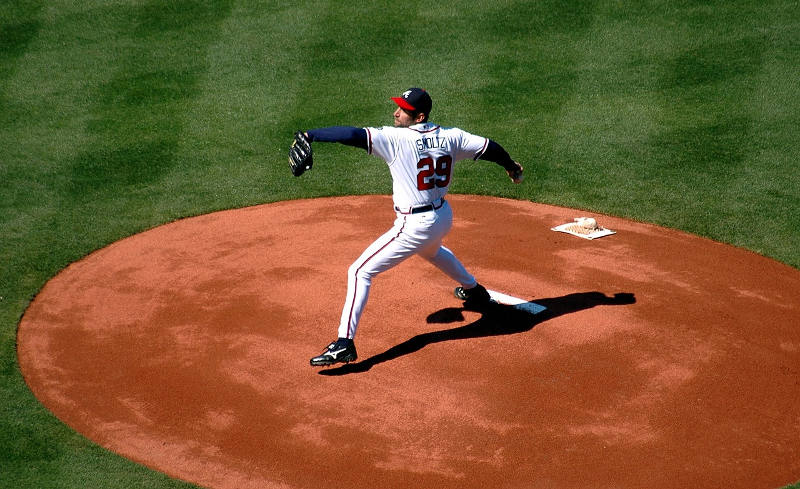
On August 6, 2018 in San Francisco, Astros’ pitcher Charlie Morton threw 97 pitches and allowed 1 run over 7 innings against the Giants. Roberto Osuna, who had just joined the Astros less than 24 hours prior, came into the game in the bottom of the 8th inning to relieve Morton. Osuna threw only 5 pitches to complete a 1-2-3 inning.
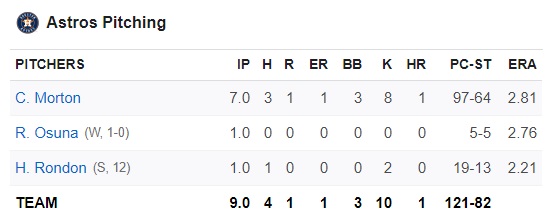
In the top of the 9th inning, with the Astros trailing 1-0, Marwin Gonzalez hit a 3-run homer off reliever Will Smith to give the Astros a 3-1 lead. Reliever Hector Rondon entered the game and finished off the Giants in the bottom of the 9th. Rondon got the save. Osuna got the win. Morton got a “no-decision.” Here’s the box score for the Astros’ pitchers;
Looking at it another way, the guy who threw 5 pitches in 1 inning gets all the credit for winning a game in which another man threw 97 pitches over 7 innings. Why? Because he just happened to be the active pitcher before Gonzalez drove in the go-ahead runs. And if you think that doesn’t make sense or that it doesn’t seem fair, I’d agree. In this post, I’ll suggest a few significant changes to the way wins, losses and saves are attributed in baseball so that credit is properly given where credit is due. The goal is to make these stats better reflect who was responsible for what happened.
27 OUTS
To win a baseball game, you have to score more runs than the other team and get them out 27 times. The first 3 outs are just as important as the last 3 outs and all the outs in-between. Any of the pitchers you use in a game can give up a bunch of runs and make it impossible for your team to win.
But if all your pitchers do their part in suppressing the opponent’s offense in a winning effort, I suggest that the credit for that collaborative effort should be shared among them all. In other words, the win should be split among the pitchers who earned it.
Splitting the Win
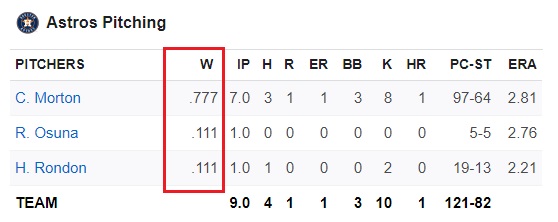
Charlie Morton deserves .777 of the credit for the Astros’ win in the above-mentioned game. He pitched 7 of the 9 innings and collected 21 of the 27 outs. Therefore, I’d say he deserves .777 of the win. Osuna and Rondon, who both pitched 1 inning and collected 3 outs apiece, should both get .111 of the win (1 divided by 9). The addition of Morton’s .777, Osuna’s .111 and Rondon’s .111 is .9999, or in other words, 1 win for the team. Here’s the box score again with an extra column which shows the breakdown of the win;
This is the fairest, most accurate and sensible way to attribute wins to pitchers. The current rule, though long-established and accepted, is nonetheless arbitrary and disproportionate. There’s no justification for giving the full win to the guy who pitched only 1 inning. If the guys who pitched before and after him had not gotten their outs and kept their team in the game, the one-inning pitcher would’ve gotten nothing but a little exercise.
Credit Where Credit Is Due
In every other area of baseball, the old and new old statistics are clearly designed to give proper credit where credit is due. If a reliever comes into a game with men on base, the previous pitcher is on the hook for those baserunners, not the incoming reliever. If they score, those earned runs (ER) are attributed to the guy who let them get on base, not the reliever who was brought in to get the team out of a jam. That’s fair.
Wins Above Replacement
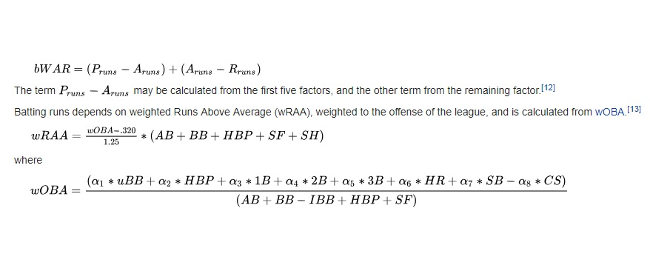
One of the newer, more nuanced stats is WAR (Wins Above Replacement). It reflects the number of additional wins that a team has achieved above the number of expected wins they would have if the player in question were substituted with a regular Joe Schmo who also plays that position. Look up the WAR stat on Wikipedia and you’ll find that this daunting formula is how a player’s WAR is calculated;
First all, this formula is ridiculous. It takes me back to my quantitative analysis courses in college. Only a computer could ever figure it out. But the more important thing to consider is that this new stat and several others reveal a genuine interest in baseball to truly evaluate a player’s individual performance and his contribution to the team. So therefore, it’s very surprising to me in this hyper-conscious era of stats and Sabermetrics that we’re still wrongly accounting for something as important as wins and losses.
The current system certainly does provide a rough idea of who deserves credit for a win and who deserves blame for a loss. A pitcher who wins 20 games clearly had an awesome season. But why should we settle for “rough ideas” in our measurements when a fairer, more accurate way of determining wins and losses is right there in front of us? It’s been under our noses the whole time.
A Winning Formula: IP / 9
Wins should be calculated by this simple formula: IP / 9 (the number of innings a pitcher pitched divided by 9 or the total number of innings played). Or you could divide the number of outs he got by 27 or the total number of outs achieved in an extra-innings game.
As I alluded above, there may be several “winning pitchers” in one game. But that one win will be proportionally divided among them according to how many outs they achieved. After all, outs are the valued output of a pitcher. Batters are all about hits, runs, RBI’s, etc. But as for pitchers, they want to strike them out, ground them out and fly them out. Outs are what matters.
The winning pitchers will each collect a percentage of a win. For example, the guy who pitched 6 innings gets .667 of the win. The guy who got the next 5 outs gets .182 on the win (5 divided by 27 total outs) and the guy who got the last 4 outs and ended the game gets .148 of the win (4 divided by 27 total outs). Once again, add up their percentages and they amount to 1. Pitching all the innings in a complete game is the only way for a pitcher to get full credit for the win.
Starting pitchers will obviously accumulate the most wins throughout the season because they pitch the most innings. On the other hand, relief pitchers will pick up little portions of the wins here and there…depending on how many outs they get. At first glance, this may seem unfair to relievers. They will certainly accumulate fewer wins in my proposed system than they do in the current system. But this change underscores the basis for the new system; relief pitchers don’t deserve full credit for a win.
Although relievers may not like a system in which they’re unable to collect as many wins as they did before, they will certainly like my suggested changes to the way that saves are allocated.
How Are Saved Determined in Baseball?
The current method for determining who gets the save (S) in a baseball game is even more convoluted than determining who gets the win. Here are all the conditions a pitcher must meet to earn a save;
- He must be the team’s last pitcher of the game
- But not the winning pitcher
- He must get at least one guy out
- He meets one of the following conditions;
a. He enters the game with a lead of 3 runs or less and pitches for 1 inning
b. He enters the game with the potential tying run on base, at bat or on deck
c. He pitches at least 3 innings
What a convoluted mess. I’m willing to bet that even the most ardent baseball fans couldn’t name all these conditions if you asked them to. Aside from how confusing it is to determine who gets the save in the current system, the bigger problem again is that it doesn’t properly allocate credit to the pitchers who protected the lead and wrapped up the game.
post continues below pic

Look at this picture. Look at these brave strangers who formed a human chain and worked together to rescue a dog from the bayou. Tell me…who saved that dog? Was it only the last guy who physically held onto the dog? Or don’t you think that everyone else in the chain deserves a portion of the credit for saving that poor animal? That’s certainly the way I see it. And that’s exactly the way I think that saves should be attributed in baseball. Click here to watch the full video of the dog’s rescue…it’s an awesome display of humanity.
Saving the Game = Protecting the Lead
After your team takes the lead in a game, from then on, you are protecting that lead. I’ll call this the “save period.” You get a few outs, the next guy gets a few outs and the last guy closes out the game. Your portion of the save, in my opinion, should be determined by dividing the number of outs you achieved by the total number of outs it took to protect the lead and finish the game.
If somewhere along the way you lose the lead, the save you were working for is obviously blown and your team must try again to reclaim the lead. And once it does, a new save period starts. Only the pitchers who get outs in the save period will get a portion of the save.
So let’s say your offense gives you a 6-1 lead in the top of the 6th. You take the mound in the bottom of the 6th and you get all 3 guys out. A “setup reliever” takes over for you in the bottom of the 7th and also pitches the 8th. And let’s say he allowed a few runs so now the score is 6-5. Your team is still protecting the same lead. Then a closer comes in and get the last 3 outs. Here’s my suggested division of the game’s save:
.250 for you for getting 3 of the 12 outs in the save period
.500 for the setup reliever for getting 6 of the 12 outs
.250 for the closer for getting the last 3 outs of the save period
A Save Is a Team Effort
Once again, add up the portions and you get a total of 1 save. After all, a save is a team effort. And therefore, the save statistic should accurately reflect that reality of the game.
If you’re still reading this long post, I’m sure you’ve already figured that my suggested changes to wins and saves could result in a scenario where one pitcher gets a portion of the win AND ALSO a portion of the save. This of course could never happen in the current system. But my reply is this; why not? If we’re just looking at the meaning of these terms, it’s perfectly accurate to say that one pitcher contributed to the win and also protected the lead.
Sharing the L
Well, I’ve come this far in my suggested overhaul of baseball pitching statistics. I might as well go all the way and suggest a change in how losses are determined. If my other suggested changes are any indication, you already know what I’m going to say; losses should be shared by the pitchers who gave up runs. That’s it.
If you lose 1-0 and you’re the pitcher who gave up the 1 run, then the full loss is on you. But if you give up 1 run in a game in which 10 runs are scored against your team, you should get only .100 of the loss. The terrible pitcher who gave up 8 of those runs will get .800 of the loss. Someone else will get the last .100
The loss shouldn’t fall on just one pitcher. It should fall proportionately on all the pitchers who allowed the runs which caused the team to lose. Let’s say a starting pitcher comes out of a game with his team down 2-1. He allowed those two runs. But then the next guy comes in and allows 5 more runs. So the score is now 7-1. Obviously, it’s going to be hard to overcome this 6-run deficit. But let’s say they put a few hits together and get a few runs, but not enough to win. The final score is 7-6.
In the current system, the starting pitcher will get the full loss even though he allowed only 2 of the 7 runs. The reliever who allowed 5 runs is mostly responsible for this loss, but this fact won’t be reflected whatsoever in the game summary. This is neither fair nor accurate. In my proposed system, the starting pitcher would get .286 of the loss (2 divided by 7) and the reliever would get .714 of the loss (5 divided by 7).
Number Lovers
Don’t even try to tell me these percentages are cumbersome or hard to keep track of. Are you kidding me? Baseball is a goldmine for statisticians and number lovers. Regular fans like myself and the managers of fantasy teams pour over these numbers with enthusiasm and delight. Why? Because for the most part, baseball stats tell a story. They indicate who is doing what. Who’s performing well, who’s in a slump, who’s a detriment to his team and who’s a contributor to his team.
And of course, baseball stats allow us to compare. This is the never-ending joy of baseball fans and talk-show hosts…debating who was better. How does Ted Williams’ .344 batting average compare to Tony Gwynn’s .338? We fixate on leaderboards. Nolan Ryan has the most strikeouts (5,714) while Randy Johnson is a distant second at 4,875.
But the lifetime and in-season tallies of wins, losses and saves has never seemed quite right. We know they’re not right. One guy often gets too much credit or too much blame while other guys who affected the game get nothing.
Recalculating the Past
The great thing about my proposed system is that it could be retroactively implemented to the beginning of baseball…or to whenever baseball stats were started. We can just as easily apply my system to a game played in 1918 as we can to a game in 2018… so long as we have the box score. And if a person or a computer were to take on the daunting task of converting all of baseball’s past to this new system, I believe we’d get a more-accurate view of the history of pitching in this wonderful game.
To me, the need for this change is very obvious. It’s so apparent that I’m sure I’m not the only person to have proposed it. However, I’ll say with perfect honesty that all the thoughts and ideas I proposed in this post are my own. They originated from my own observations after 4 decades of watching baseball, collecting baseball cards, comparing stats and thinking about the game.
As for the name of this new system, I suppose it could be called Merit-Based Pitching Statistics until a better name is determined. Unfortunately, I have little hope that the MBPS will ever be used in a league which is so slow and reluctant to change. If it took MLB so long to accept interleague play, they might never get around to implementing the radical ideas I’ve suggested here. But they should.
Leave A Comment